
Pie Charts
Pie Charts: Overview
This topic covers concepts, such as, Characteristics of Pie Charts, Pie Chart, Formation of Table from Pie Chart & Pie Charts for Continuous Variable etc.
Important Questions on Pie Charts
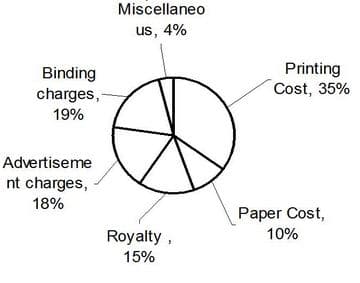
The pie chart given here shows various expenses of a publisher in the production and sale of a book. Study the chart and answer these questions based on it.
What is the number of candidates qualified from state E?
Study the following Pie-Chart carefully to answer these questions.
Total students
Percentage distribution of students in a different courses.
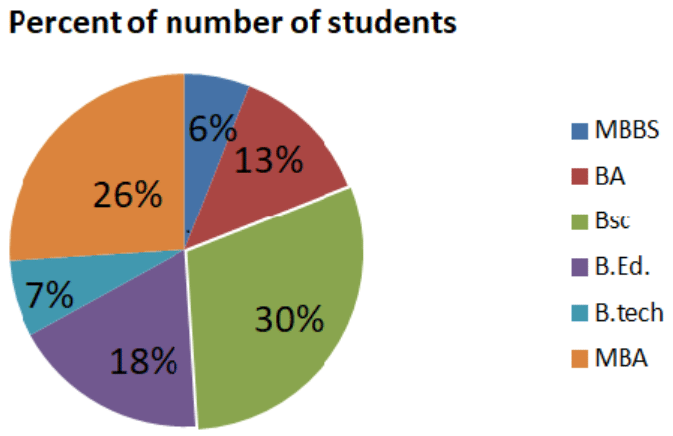
What is the total number of students B.Ed, B.A., and MBBS together?
Study the chart and answer the question below:
The following pie chart shows the collection of revenue of the Govt. of India in different departments.
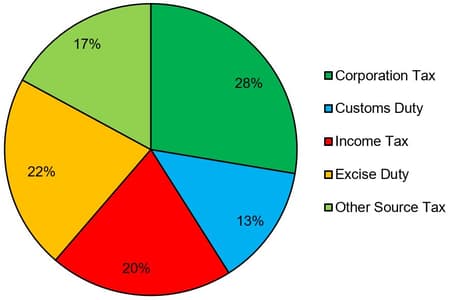
What is the total revenue from excise and corporation tax earned by Govt. of India, if the total revenue collected by Govt. of India is ?
Directions: Study the Pie-charts below to answer the following question.
The below pie-charts shows the distribution of candidates who joined M.B.A. programme and successfully completed it.
The below pie chart shows the number of candidates who join MBA,

The number of candidates who join MBA
The below pie chart shows the number of candidates who completed MBA,
The number of candidates who completed MBA
The number of candidates who completed the M.B.A. programme from A and D Institutes together exceeds the number of candidates who joined Institutes C and E together by-
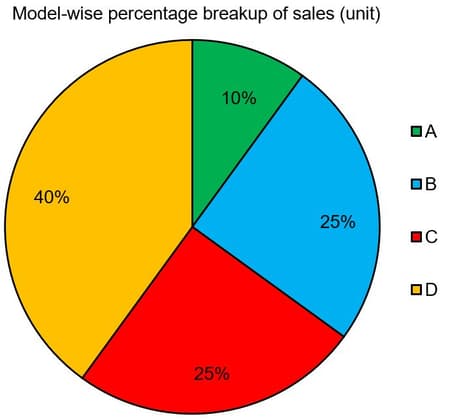
The above pie charts given the sales of scooters by different companies for
Scooter sales in
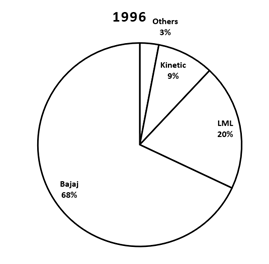
Scooter sales in
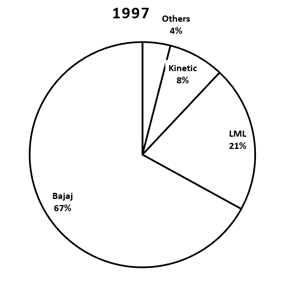
Sales in
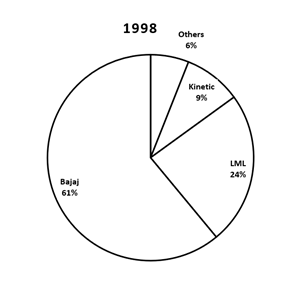
Assuming the scooter market grows by for the next two years and the market share of LML, kinetics and others remain the constant, then the market share of Bajaj in shall be ________.
These questions are based on the following pie charts.
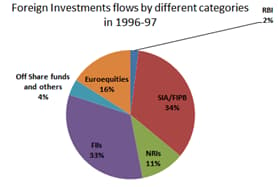
Total investment flows
In the FII sector, how many degrees approximately should be in the central angle?
Directions: Study the pie chart and answer the questions given below.
Air conditioner manufacturing company manufacturing models of air conditioners - . In the year the company generates a revenue of by selling air conditioners.
The manufacturing cost of each AC is .

Percentage profit is maximum for which models?
Study the following pie chart carefully to answer these questions.
The following pie chart gives the expenditure of funds by the university for various purposes.
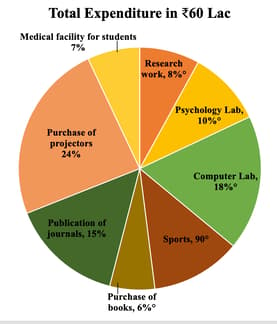
What is the respective ratio between the expenditure made by the university on research work and the purchase of books for the library?
Distribution of candidates who were enrolled for MBA entrance exam and the candidates (out of those enrolled) who passed the exam in different institutes: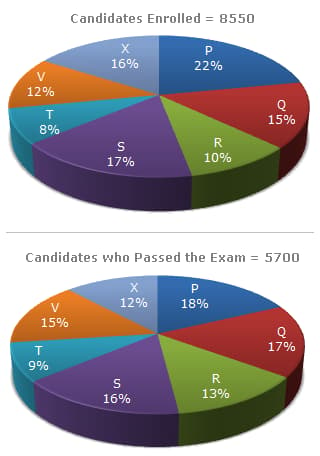
What percentage of candidates passed the Exam from institute T out of the total number of candidates enrolled from the same institute?
The pie chart given below, shows the expenditure on various items and saving of a family during the year 2009. Study the pie chart and answer question nos. 96 to 100 based on it.
PERCENTAGE OF MONEY SPENT ON VARIOUS ITEMS AND SAVINGS BY A FAMILY DURING 2009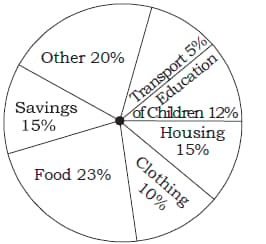
The percentage of the income which was spent on clothing, education of children and transport together is
Directions: For the questions given below, a pie graph is given. Study the graph carefully and answer the following questions by choosing the best answer from the five alternatives given below the question.
The following pie-chart gives the monthly expenditure of Apurva
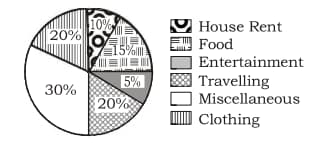
How much should be the total expenditure of Apurva if his expenditure on house rent and travelling is ?
Study the following pie chart and answer the questions.
Total income
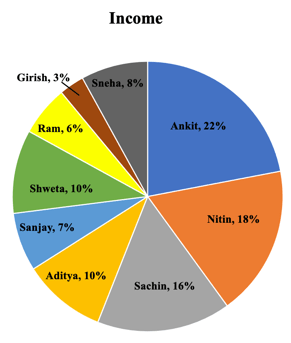
What is Ankit's income?
The pie chart given here shows various expenses of a publisher in the production and sale of a book. Study the chart and answer these questions based on it.
What is the total number of candidate qualified from state 'A' and 'B' together ?
The following question is based on the following pie chart.
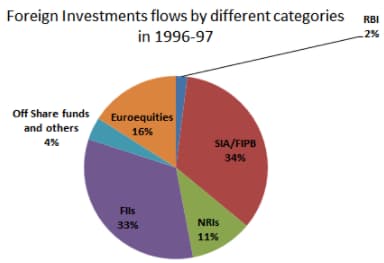
Total investment flows US
If the total investment flow were to be doubled and FIIs were to be halved in the next year, what would be the proportion of FIIs in the total investment flows?
The following graphs show the distribution of workers of different categories (A to D) in the retail sector and the insurance sector.
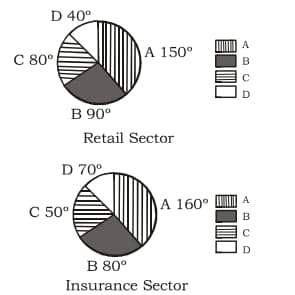
If the total number of workers in category B of the retail sector is , then how many workers are there in category D of the insurance sector?
Read the following pie-chart carefully and answer the questions given below. Degree wise distribution of expenditure by a country on different sports in
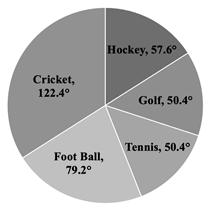
If total expenditure on sports in was , how much money is more expend in Golf then tennis?
Study the following pie-chart diagrams carefully and answer the questions given below it.
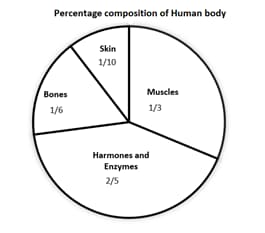
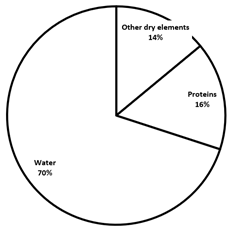
What is the ratio of the distribution of proteins in the muscles to that of the distribution of proteins in the bones?
Study Pie chart carefully to answer the following questions.
Percentage of students enrolled in different activities in a school
Total no. of students
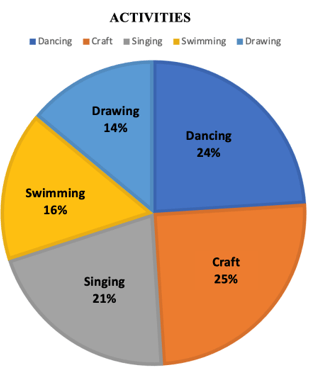
Percentage of Girls enrolled in these activities out of total of the total students.
Number of total girls students is
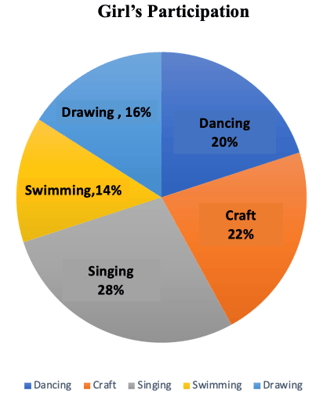
What is the approximate percentage of boys in the school?
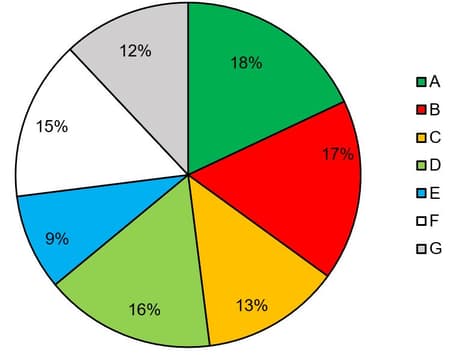
Study the pie-chart below and answer the questions.
Percentage distribution of total expenditure of a company.
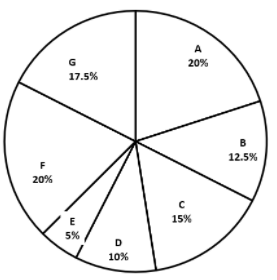
A = Infrastructure
B = Transport
C = Advertisement
D = Taxes
E = Research and Development
F = Salary
G = Interest on Loans
The expenditure on 'Interest on Loans' is what percent more than the expenditure on 'Transport'?
Study the below graph and answer the following question:
The below pie chart shows the total weight of the sweets,
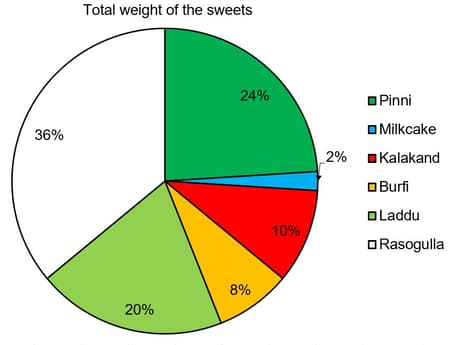
The total weight of the sweets
The below pie chart shows the total cost of the sweets,
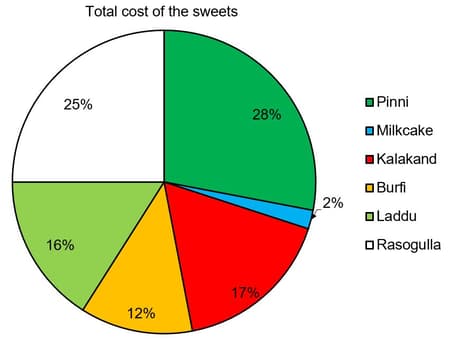
The total cost of the sweets
At that rate does the shopkeeper sell Kalakand?


